Tools Dashboard Analytics Overview
This article will guide you through Patch’s Tools Dashboard Analytics. Patch’s Tools Dashboard provides you with real-time data and insights to help you keep a pulse on your business. In-depth reporting and metrics from Messenger, TextChat, SmartLinks, and more. See how your reps are performing, the top categories of message requests from customers, the number of touchpoints per conversation, and much more.
Note: Any tool or add-on that is not active on the account and has a related card on the tools page will be hidden.
Customer Engagement Card
Features
- Date Picker
- Bar Graph
- Metrics
- Refresh Button
Date Range Selector (top right)
Use this menu to update the date range you would like to view within the XXX card.
Bar Graph (top)
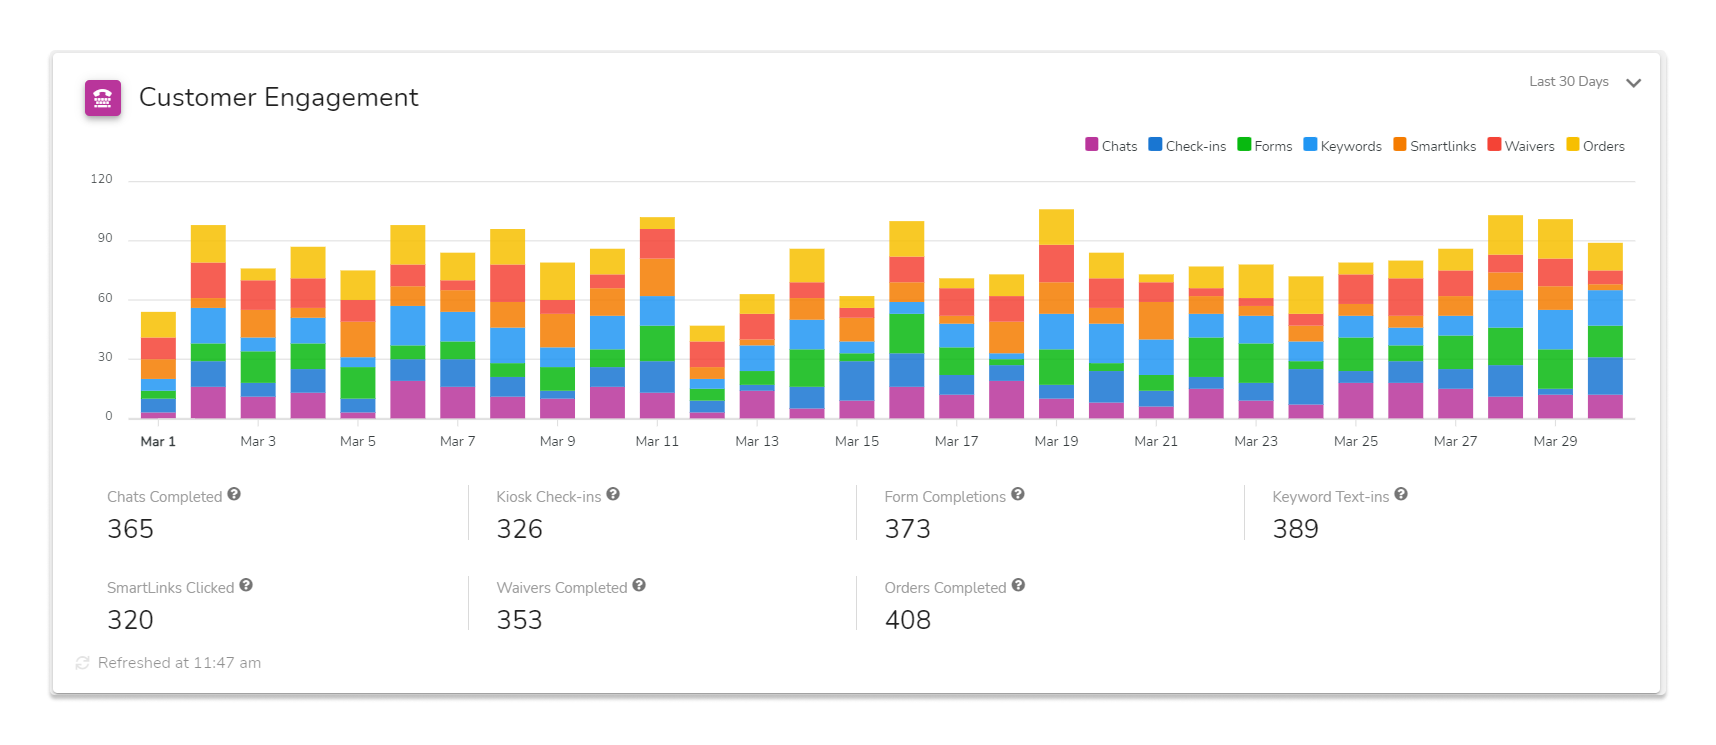
This chart includes daily customer engagement activity in a bar graph style chart to help visualize the most active days for customer engagement for all your marketing tools used by your business. Each bar represents one day and all tools with engagement for that day which helps to see trends in engagement activity over time.
Chats
The total number of conversations that were marked complete for the date.
Check-Ins (Physical Locations)
The total number of kiosk check-ins completed for the date. This data is only available to you if the Kiosks add-on is active on your account.
Forms (non-Shopify)
The total number of forms completed for the date. This data is only available to you if the Forms add-on is active on your account.
Keywords
The total number of keyword text-in for the date. This data is only available to you if the keywords add-on is active on your account.
SmartLinks
The total number of SmartLinks clicked for the date. This data is only available to you if the SmartLinks add-on is active on your account.
Waivers (non-Shopify)
The total number of waivers completed for the date. This data is only available to you if the waiver add-on is active on your account.
Orders
The total number of orders completed for the date. This data is only available to you if the orders add-on is active on your account.
Metrics (bottom)
The metrics beneath the bar chart directly correlate with the data in the bar chart. These metrics are a summation of all engagement activity per tool within the date range selected.
Chats Completed
The total number of conversations that were marked complete during the date range selected.
Kiosk Check-ins (Physical Locations)
The total number of finished check-ins during the date range selected. This data is only available to you if the Kiosks add-on is active on your account.
Form Completions (non-Shopify)
The total number of forms completed during the date range selected. This data is only available to you if the form add-on is active on your account.
Keyword Text-ins
The total number of times a Keywords was texted in during the date range selected. This data is only available to you if the keywords add-on is active on your account.
SmartLinks Clicked
The total number of any SmartLink was clicked during the date range selected. This data is only available to you if the SmartLinks add-on is active on your account.
Waivers Completed (non-Shopify)
The total number of waivers completed during the date range selected. This data is only available to you if the Waivers add-on is active on your account.
Orders Completed
The total number of completed orders during the date range selected.
Refresh Button (bottom left)
Use this button to refresh the data within the XXX Card.
Loyalty Card
Features
- Date Picker
- Loyalty v Non Loyalty Table
- Bar Graph
- Metrics
- Refresh Button
Date Range Selector (top right)
Use this menu to update the date range you would like to view within the Loyalty card
Loyalty v Non Loyalty Table (left)
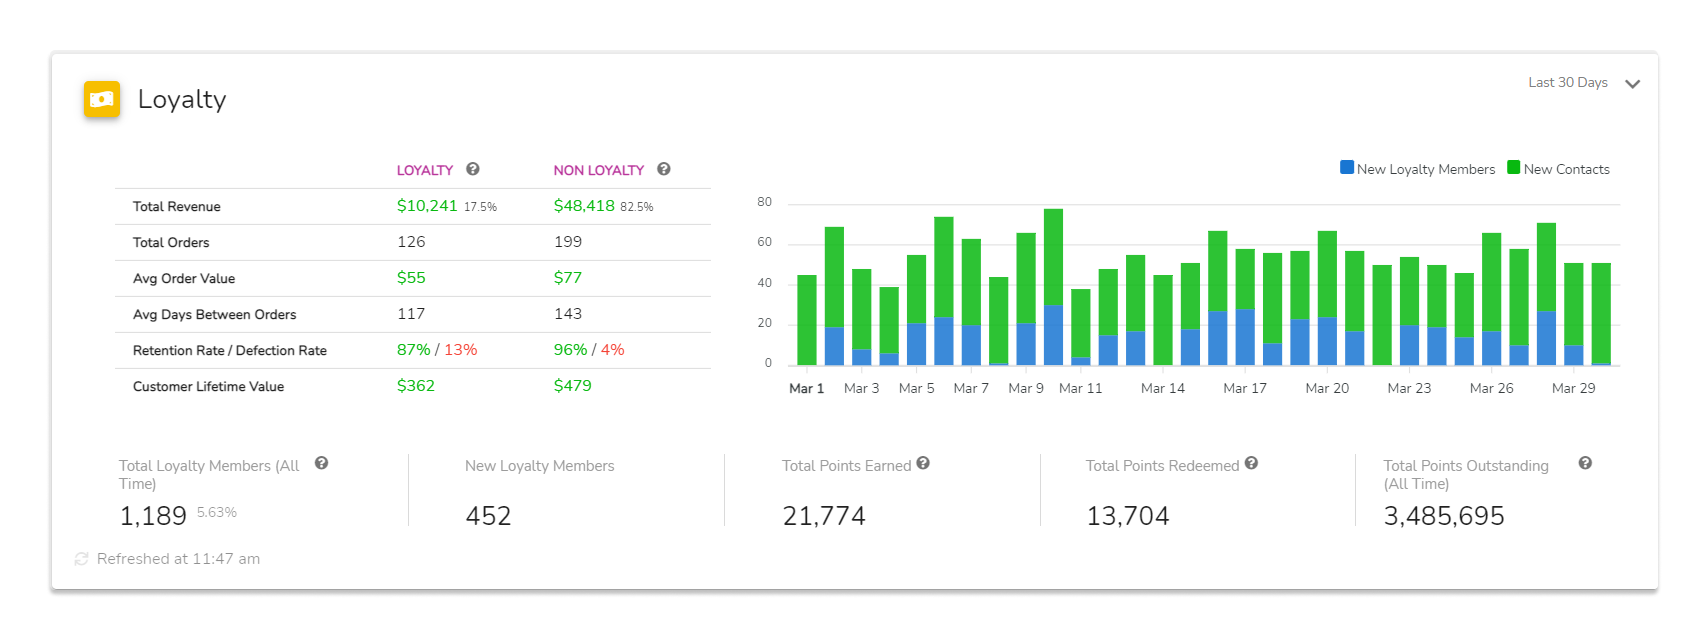
The Loyalty column reports on customers who have signed up for Loyalty & Reward. The Non Loyalty column reports on customers who have not signed up for Loyalty & Reward.
Total Revenue
The total revenue generated from orders and the percentage of total revenue. For example, if you were to do $100,000 in revenue in the last 30 days and your Loyalty customers generated $80,000 of revenue then the data would show $80,000 and 80%. Note: Refunded orders are subtracted from revenue calculations.
Total Orders
The total number of orders created within the date range selected. Note: Refunded orders are subtracted from the total order count.
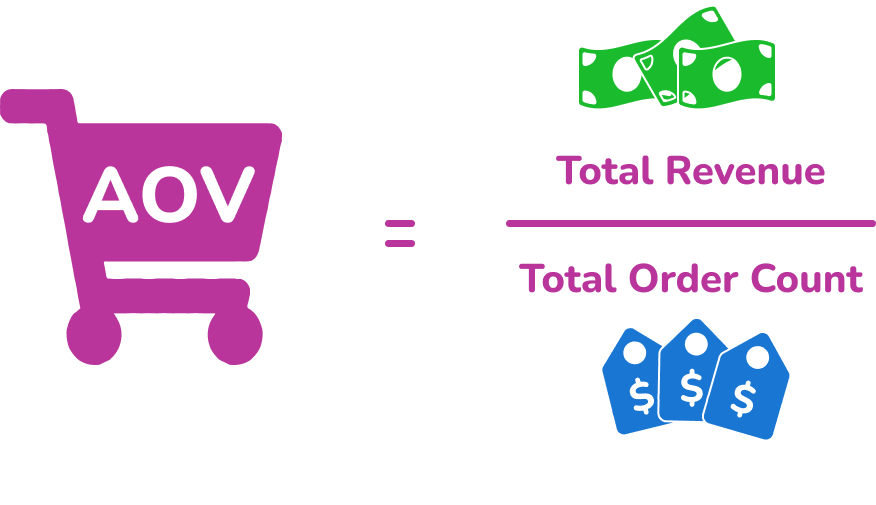
Avg Order Value
Average order value (AOV) is the average order total spent when a customer places an order with your business. Knowing the average order value is used to help you make decisions about your pricing strategies. You can directly impact your revenue growth by increasing your AOV. Note: Refunded orders are subtracted from revenue calculations. Below is how we calculate
AOV:
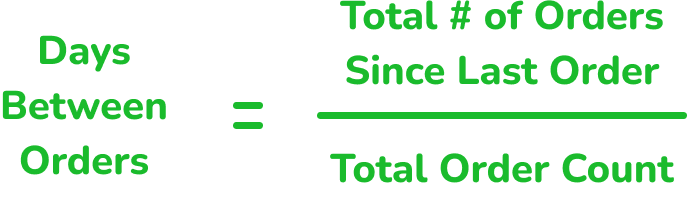
Avg Days Between Orders
Knowing the average number of days between orders is useful in planning your marketing strategies for each customer segment. This metric only includes returning customers and excludes first-timers. Below is how we calculate days between orders:
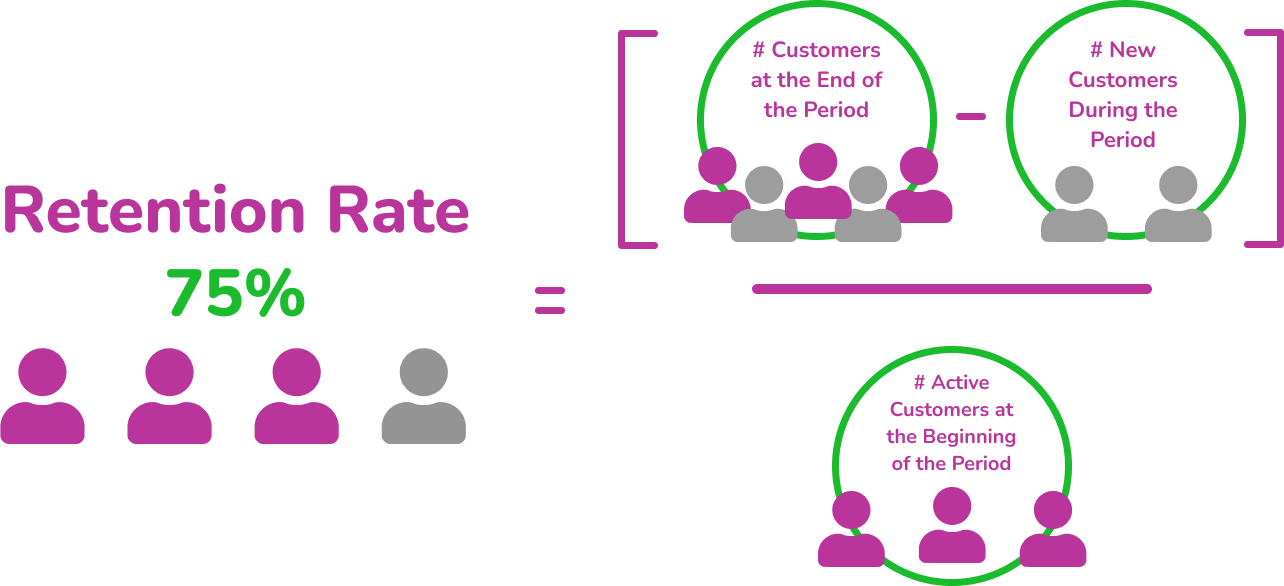
Retention/Defection Rate
Retention rate only pulls for customers that have had a chance to churn. So they must have been a customer longer than 365 days or what is set manually within the RFM settings -> Days Until Lost. Defection rate is the opposite of Retention rate and represents your customer churn. To calculate defection rate you would simply need to subtract the Retention rate from 100%.
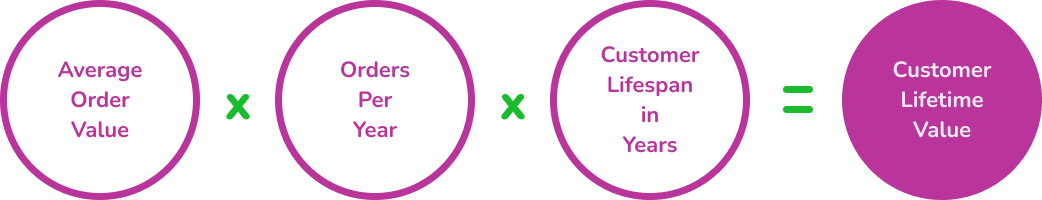
Customer Lifetime Value
Customer lifetime value is the total worth to a business of a customer over the whole period of their relationship. Note: Refunded orders are subtracted from revenue calculations.
Bar Graph (right)
This chart includes daily activity for new contacts in a bar graph style chart to help visualize the most active days for new loyalty members and new contacts added to your database. Each bar represents one day and both segments for that day which helps to see trends in loyalty and non-loyalty sign-ups over time. Hover over a key in the legend in the top right-hand corner of the chart to highlight only that segment.
New Loyalty Members
Contacts added to the database with a loyalty tag that was added during the date range selected.
Note: If a contact’s Loyalty Member status changes multiple times a day, it does not count as multiple new loyalty members.
New Contacts
New contacts added to the database that did not sign up for the loyalty program within the date range selected.
Metrics (across bottom)
Total Loyalty Members (All Time)
This metric is not dependent on the date range selected but instead includes an all time count of loyalty members in your database. The rate is the total number of loyalty members divided by the total number of contacts.
New Loyalty Members
The total number of contacts added to the database with a loyalty tag that were added from data within the date range selected.
Total Points Earned
Total number of points earned from purchases or Ways to Earn for the account across all contacts from data within the date range selected.
Total Points Redeemed
Total number of points that have been cashed in across all contacts from data within the date range selected.
Total Points Outstanding (All Time)
This metric is not dependent on the date range selected but instead includes an all time count of points earned that have been cashed in (including manual adjustments).
Refresh Button (bottom left)
Use this button to refresh the data within the Loyalty Card.
Messenger Card
Features
- Date Picker
- Line Chart
- Metrics
- Heatmap Chart
- Refresh Button
Date Range Selector (top right)
Use this menu to update the date range you would like to view within the Messenger card.
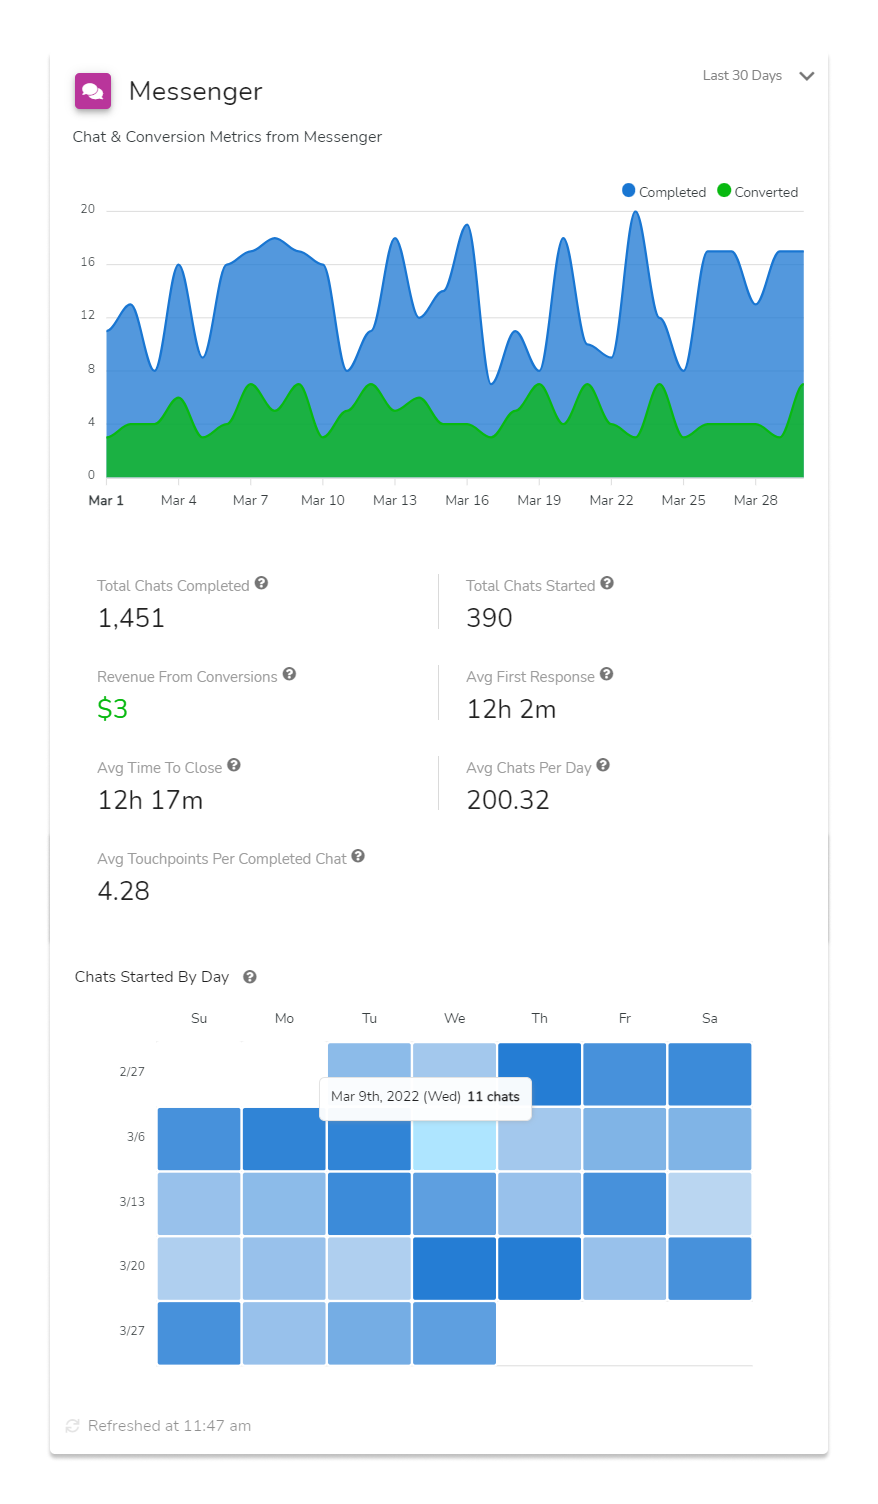
Line Chart - Chat & Conversion Metrics from Messenger (top)
Completed
The daily count over time of conversations that were marked as ‘Complete’ within the date range selected.
Converted
The daily count over time of contacts that have a conversion associated with a message received from messenger within the date range selected.
Metrics (middle)
Total Chats Completed
The total number of conversations that were marked as ‘Complete’ within the date range selected. This metric is directly correlated with the line chart above and is a summation of the daily completed chats.
Total Chats Started
The total number of conversations that were started within the date range selected.
Revenue From Conversions
The total revenue generated from all conversions associated with a conversation from messenger within the date range selected.
Avg First Response
The average amount of time it takes for a rep to respond to a message based on all conversations within the date range selected.
Avg Time To Close
The average amount of time it takes for a chat to be completed based on all conversations within the date range.
Avg Chats Per Day
Total number of messages sent by a rep divided by the number of all messages within the date range.
Avg Touchpoints Per Completed Chat
The total number of messages sent by a rep before being able to complete each chat within the date range selected.
Heatmap Chart - Chats Started By Day
This chart includes Chats Started By Day activity in a heatmap style chart to help visualize the most active times chats start from within your business. Each row represents one week which helps to see trends in chat activity over time and will help you ensure you have enough reps available to service your customers.
Refresh Button (bottom left)
Use this button to refresh the data within the Messenger Card.
TextChat Card
Features
- Date Picker
- Line Graph
- Metrics
- Refresh Button
Date Range Selector (top right)
Use this menu to update the date range you would like to view within the TextChat Card.
Line Graph
Chats Started via TextChat
The daily count over time of chats started via TextChat from data within the date range selected.
Metrics
TextChats Started
Total number of chats started via the TextChat widget from data within the date range selected.
TextChat Subscribers
The number of contacts who opted in to subscribe from the TextChat Widget from data within the date range selected.
TextChat Subscription Rate
The number of contacts who opted in to subscribe from within the TextChat Widget versus the total number of TextChat chats started from data within the date range selected. Note: If a contact’s subscription status changes multiple times in a day, it does not count as multiple subscriptions.
Refresh Button (bottom left)
Use this button to refresh the data within the TextChat Card.
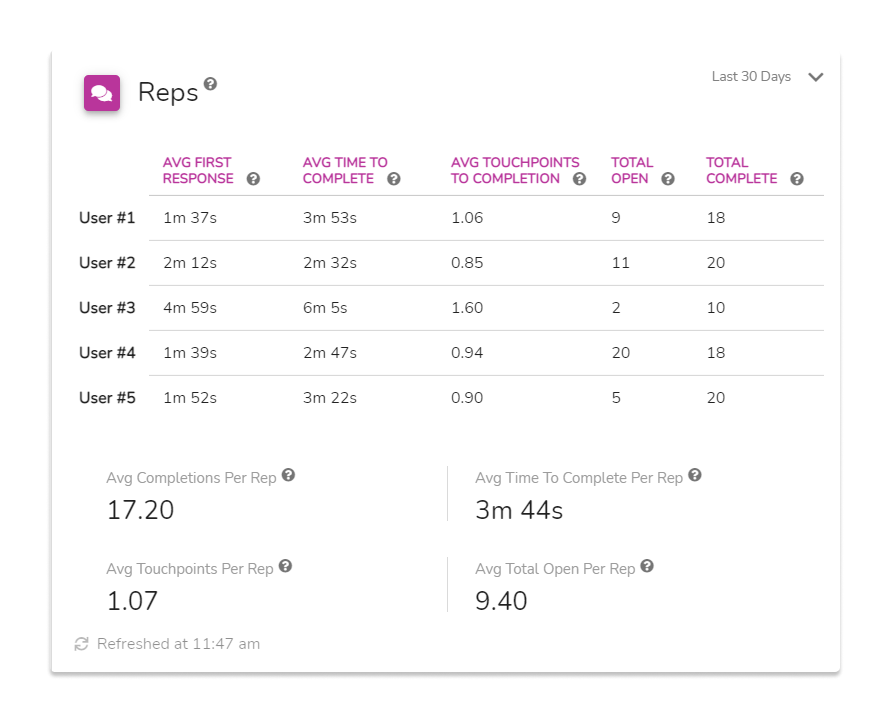
Reps Card
Note: All data within this card is based upon ‘Completed’ conversations.
Features
- Date Picker
- Table
- Metrics
- Refresh Button
Date Range Selector (top right)
Use this menu to update the date range you would like to view within the Reps Card.
Table (top)
Rep Name
The name of the rep.
Avg First Response
The average amount of time it takes for each rep to respond to a message based on their total completed conversations within the date range selected.
Avg Time To Complete
The average amount of time it takes for each rep to complete a chat, based on all completed conversations within the date range selected.
Avg Touchpoints to Completion
The average number of messages sent by a rep being able to complete each chat within the date range selected.
Total Open
The total number of open conversations for each rep during the date range selected.
Total Complete
The total number of conversations marked as ‘Complete’ for each rep during the date range selected.
Metrics (bottom)
Avg Completions Per Rep
The total number of completed conversations divided by the total number of reps based on the date range selected.
Avg Time To Complete Per Rep
The average amount of time it takes for each rep to complete a chat, based on all completed conversations within the date range selected.
Avg Touchpoints Per Rep
The average number of messages sent by all reps before being able to complete each chat within the date range selected.
Avg Total Open Per Rep
The total number of open conversations for each rep during the date range selected.
Refresh Button (bottom left)
Use this button to refresh the data within the Reps Card.
Forms Card (non-Shopify)
Features
- Date Picker
- Sparkline Table
- Metrics
- Refresh Button
Date Range Selector (top right)
Use this menu to update the date range you would like to view within the Forms card.
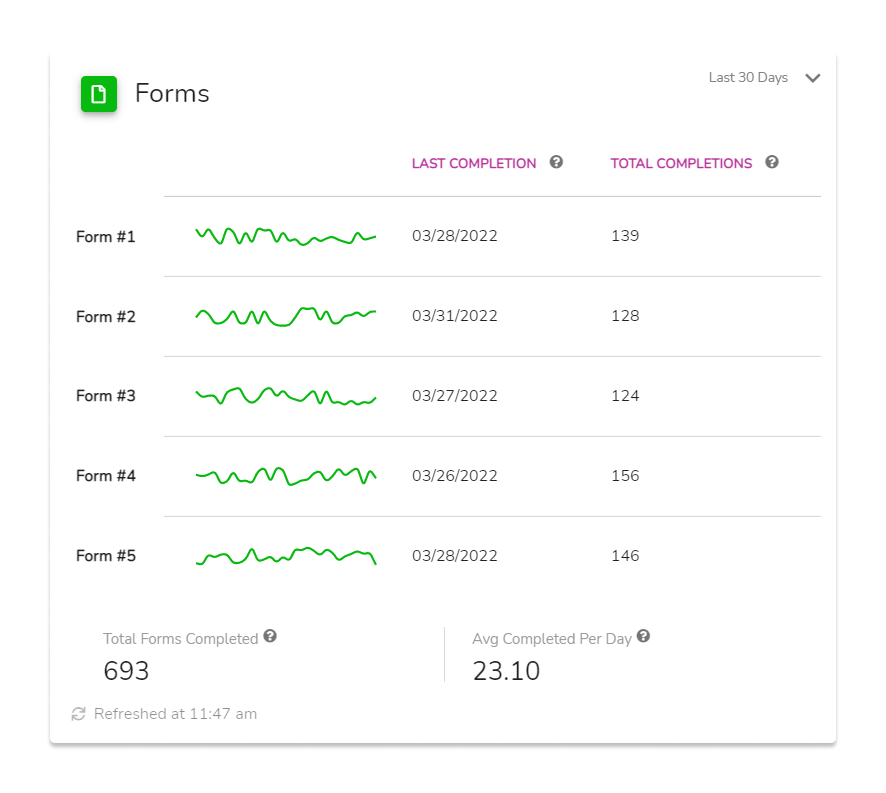
Sparkline Table (top)
Form Name
The name of the form.
Sparkline
A sparkline of the number of forms completed from data within the date range selected.
Last Completion
The last date each form was completed from data within the date range selected.
Total Completions
The total number of times each form was completed from data within the date range selected.
Metrics (bottom)
Total Forms Completed
The total number of completions for all forms from data within the date range selected.
Avg Completed Per Day
The total number of all form completions divided by 30 days.
Refresh Button (bottom left)
Use this button to refresh the data within the Forms Card.
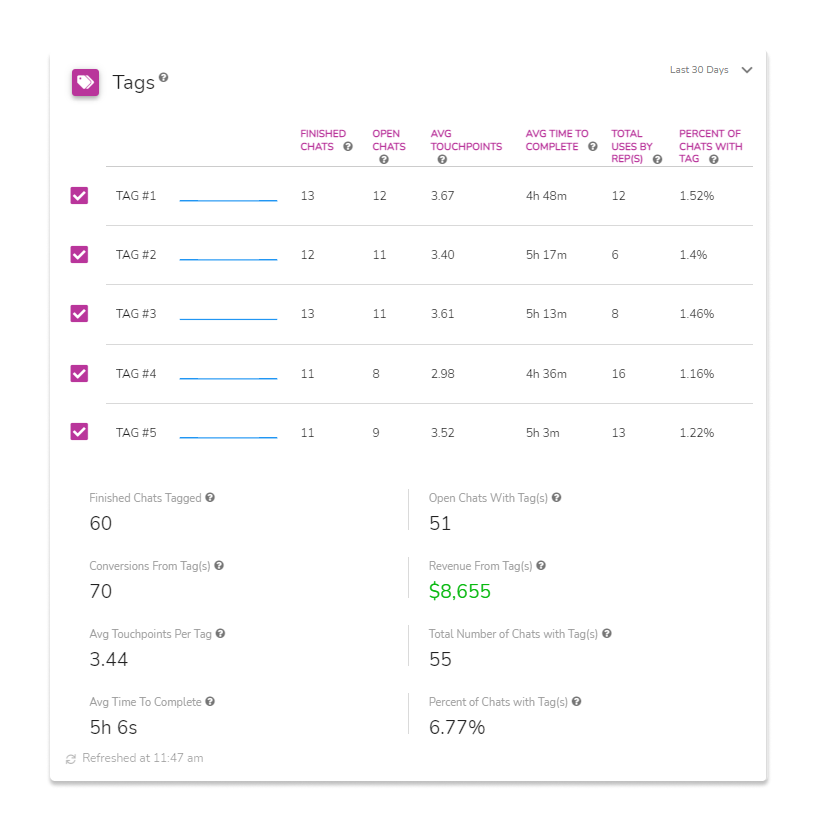
Tags Card
The top tags from Messenger AND TextChat were used from data within the date range selected.
Note: 10 tags maximum. Top 10 tags displayed.
Features
- Date Picker
- Sparkline Table
- Selectable Tag Rows to limit data
- Metrics
- Refresh Button
Date Range Selector (top right)
Use this menu to update the date range you would like to view within the Tags card.
Sparkline Table
Select A Tag Row
Tags rows are selectable to limit the data returned to the metrics on the entire card to the selected tags only.
Tag Name
The name of the tag.
Sparkline
A sparkline of the number of tags used over the date range selected.
Finished Chats
The total number of completed chats where the tag was applied within the date range selected.
Open Chats
The total number of open chats where the tag was applied within the date range selected.
Avg Touchpoints
The average of the total number of messages sent by a rep before being able to close each chat where the tag was applied during the date range selected.
Avg Time To Complete
The average amount of time it takes for each rep to complete a chat where the tag was applied within the date range selected.
Metrics
Finished Chats Tagged
The total number of chats that were marked as ‘Complete’ where the selected tags were applied during the date range selected.
Open Chats With Tag(s)
The total number of chats that have not been marked as ‘Complete’ where the selected tags were applied within the date range selected.
Conversions From Tag(s)
The number of customers who made a purchase within 7 days of communicating through Messenger where tags were applied.
Revenue From Tag(s)
The total revenue generated from the conversion where the selected tags were applied to chats tithing the date range selected.
Avg Touchpoints Per Tag
The number of messages sent at the time of chat completion from selected tags applied within the date range selected.
Total Number of Chats With Tag(s)
The total number of conversations both open and closed where tags were applied.
Avg Time To Complete
The average amount of time it takes for each rep to complete a chat, based on all completed chats within the date range selected where the tags selected were applied.
Percent of Chats With Tag(s)
The total chats (open and closed) divided by the total number of chats where tags were applied (open and closed).
Refresh Button (bottom left)
Use this button to refresh the data within the Tags Card.
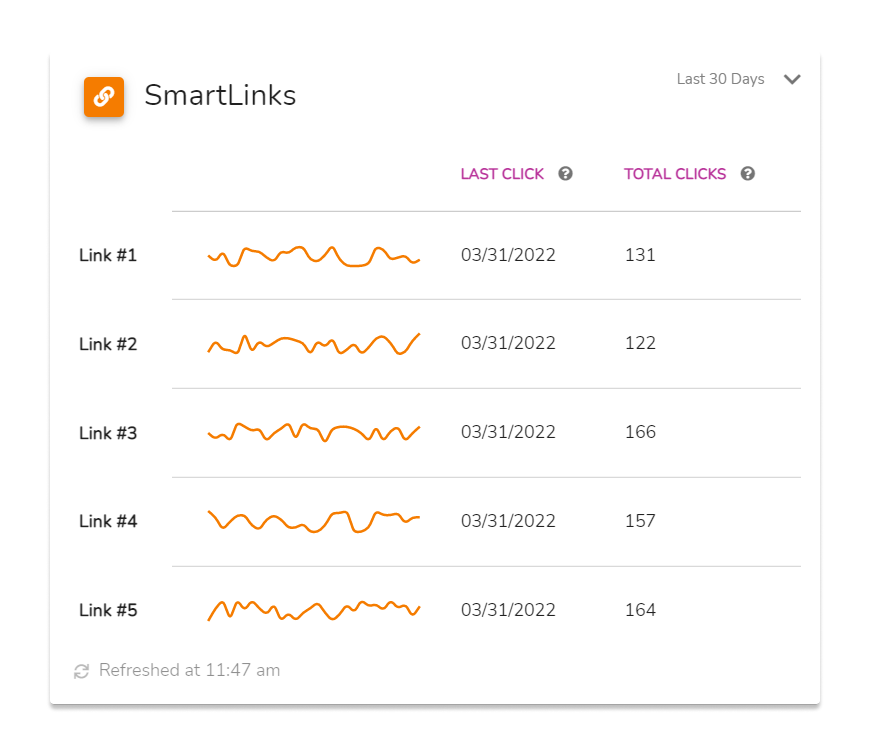
SmartLinks Card
Features
- Date Picker
- Sparkline Table
- Refresh Button
Date Range Selector (top right)
Use this menu to update the date range you would like to view within the SmartLinks card.
Sparkline Table
This table is listed in descending order starting with the SmartLink with the most number of clicks from data within the date range selected.
SmartLink Name
The name of the SmartLink
Sparkline
A sparkline of the number of SmartLink clicked over the date range selected.
Last Click
The last date the SmartLink was clicked within the date range selected.
Total Clicks
The total number of times the SmartLink was clicked within the date range selected.
Refresh Button (bottom left)
Use this button to refresh the data within the SmartLinks Card.
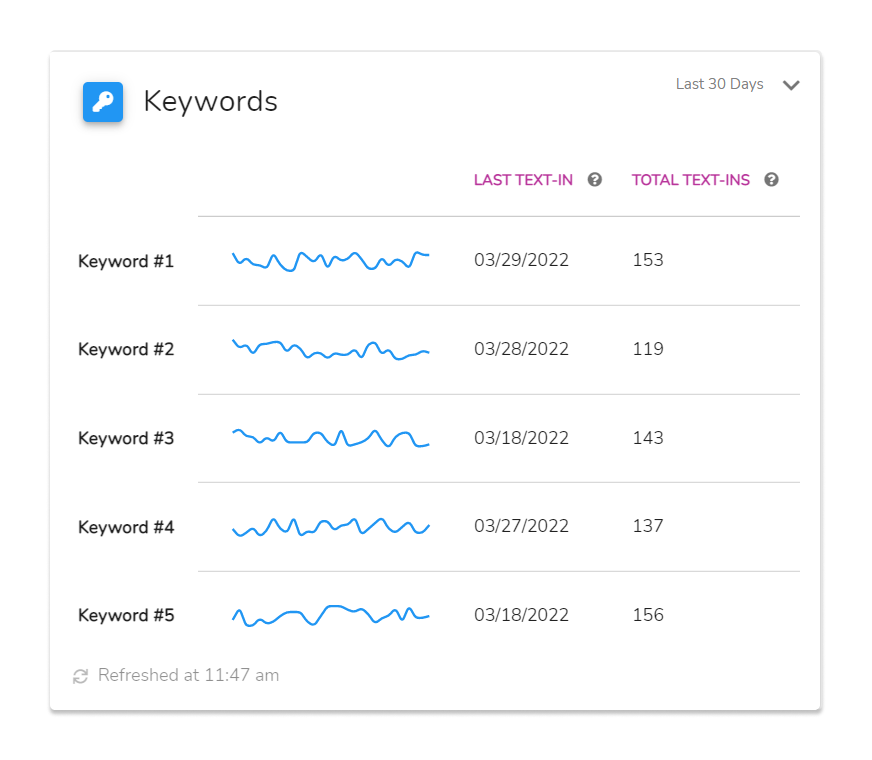
Keywords Card
Features
- Date Picker
- Sparkline Table
- Refresh Button
Date Range Selector (top right)
Use this menu to update the date range you would like to view within the Keywords card.
Sparkline Table
This table is listed in descending order starting with the Keywords with the most number of text-ins from data within the date range selected.
Keyword Name
The name of the Keyword.
Sparkline
A sparkline of the number of times the Keyword was used from data within the date range selected.
Last Text-In
The last date the Keyword was texted in from data within the date range selected.
Total Text-Ins
The total number of times the keyword was texted in from data within the date range selected.
Refresh Button (bottom left)
Use this button to refresh the data within the Keywords Card.
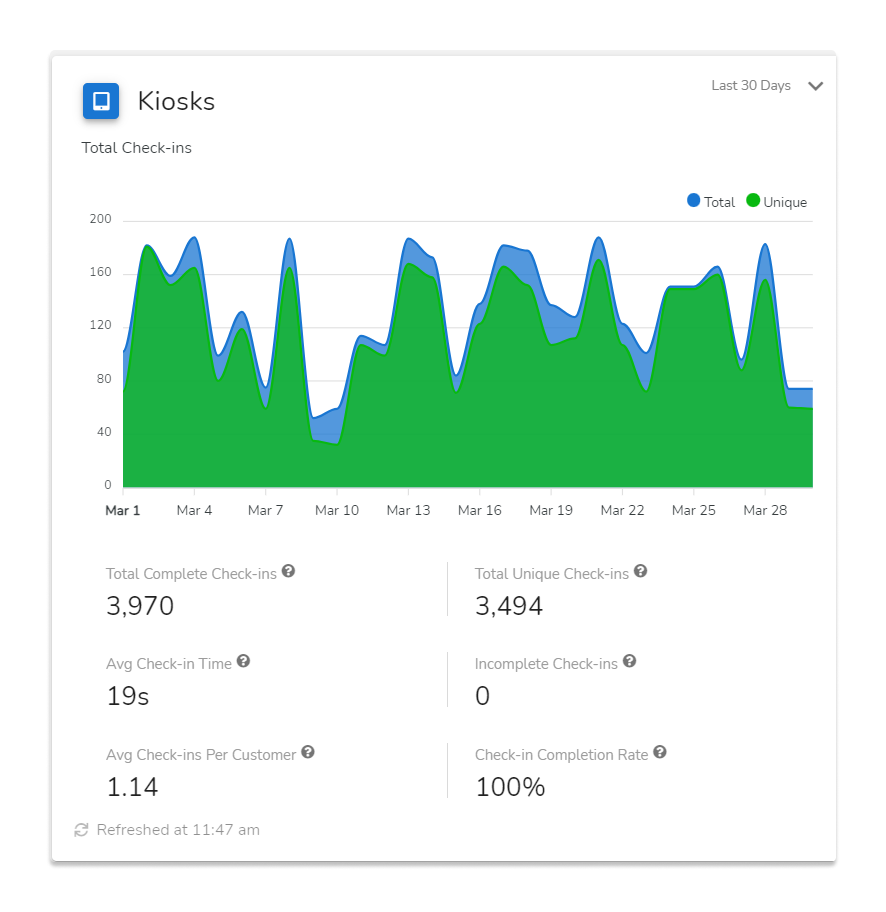
Kiosks Card (Physical Locations)
Features
- Date Picker
- Line Graph - lookup this specific type and what it is good for
- Metrics
- Refresh Button
Date Range Selector (top right)
Use this menu to update the date range you would like to view within the Kiosks card.
Line Graph (top) - Total Check-ins
Total
The daily count of all check-ins from data within the date range selected.
Unique
The daily count of unique check-ins from data within the date range selected.
Metrics (bottom)
Total Complete Check-ins
This metric directly correlates to the Total Check-ins Line Chart above and is a summation of the total number of finished check-in events from data within the date range selected.
Total Unique Check-ins
This metric directly correlates to the Total Check-ins Line Chart above and is a summation of the total number of unique, finished check-in events from data within the date range selected.
Avg Check-in Time
On average, the amount of time it takes for a customer to complete the check-in process from data within the date range selected.
Incomplete Check-ins
The total number of completed check-ins minus the total number of check-ins started from data within the date range selected.
Avg Check-ins Per Customer
The total number of finished check-ins divided by the total number of unique check-ins from data within the date range selected.
Check-in Completion Rate
The total finished check-ins plus the total number of incomplete check-ins divided by the total number of finished check-ins times 100 from data within the date range selected.
Refresh Button (bottom left)
Use this button to refresh the data within the Kiosks Card.
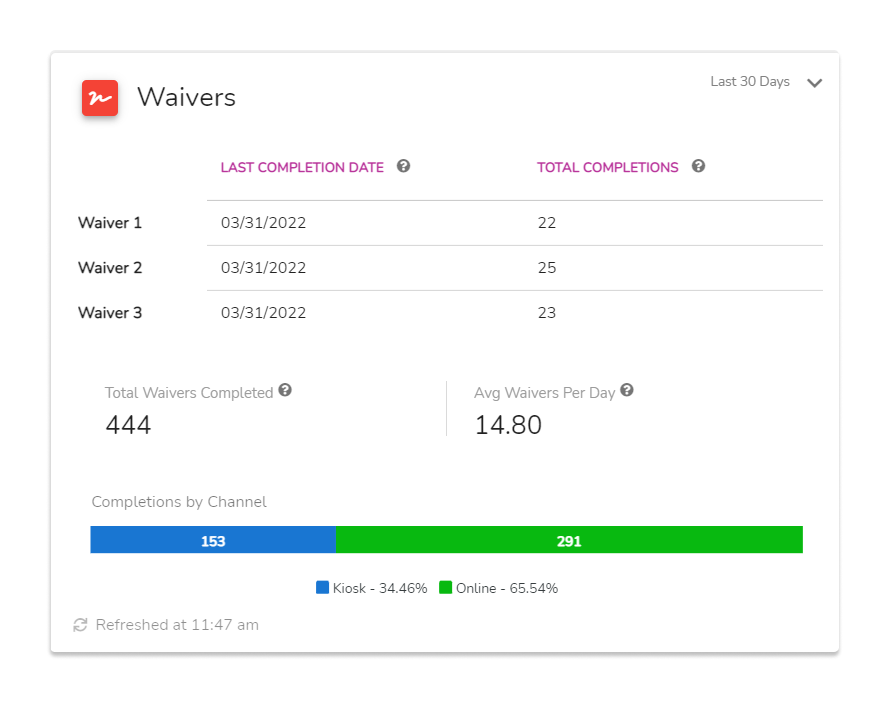
Waivers Card (non-Shopify)
Features
- Date Picker
- Data Table
- Metrics
- Split Bar Chart
- Refresh Button
Date Range Selector (top right)
Use this menu to update the date range you would like to view within the Waivers card.
Data Table (top)
Waiver Name
The name of the Waiver.
Last Completion Date
The date the waiver was last completed from data within the date range selected.
Total Completions
The total number of completed waivers from data within the date range selected.
Metrics (middle)
Total Waivers Completed
The total number of waiver completions for all waivers from data within the date range selected.
Avg Waivers Per Day
The total number of completed waivers divided by 30.
Split Bar Chart (bottom) - Completions By Channel
Kiosks (Physical Locations)
The total number of waivers completed within the Kiosk channel from data within the date range selected.
Online
The total number of waivers completed within the Online channel from data within the date range selected.
Refresh Button (bottom left)
Use this button to refresh the data within the Waivers Card.
Wrap Up
Don’t stop at just connecting with your customers, the data Patch collects and tracks will help you exceed their expectations turning more customers into Loyalists and Champions. Having an in-depth understanding of how your customers interact with your business on a day-to-day basis allows you to optimize operations for an even higher return on investment.
Tools Overview